
Hi Friends,
Welcome to the 198th issue of the Polymathic Engineer newsletter.
It's been a long time since we posted our latest machine learning article. In the previous issues, we have seen how to build classifiers such as the perceptron, which answers with a hard yes or no, and logistic regression, which answers with a probability.
However, being able to evaluate the performance of different models is as important as being able to train them. We seldom train a single model on a dataset. We usually train several different models and select the one that performs best. We also need to make sure a model is good enough before putting it in production. So we need a way to measure how good a classifier is.
The simplest way to measure the performance of a classification model is to calculate its accuracy, which indicates how often the model provides a correct result. But accuracy doesn’t paint the whole picture. If a colleague tells you they built a fraud detector that is right 99% of the time, should you be impressed? Let’s be honest: that number alone tells you almost nothing.
To fix this, we’ll define useful metrics like precision and recall. The outline is as follows:
- The accuracy trap
- Four kinds of outcomes and the confusion matrix
- Recall: catching all the positives
- Precision: trusting the positives
- One number for both: the F-score
- The threshold trade-off
- One number for all thresholds: the ROC curve and the AUC
- Putting everything into practice
To learn technical skills, you must work on real projects. CodeCrafters is a great platform for that. You can build your own Redis, Kafka, DNS server, SQLite, HTTP server, or Git from scratch using your chosen programming language.
The accuracy trap
Accuracy is the ratio between the number of correctly predicted data points and the total number of data points. In other words, it is the percentage of times that a model is correct. For example, if you evaluate a model on a test set of 1,000 samples and it guesses the right label 875 times, its accuracy is 875/1000 = 0.875, or 87.5%.
Accuracy is the most common way to evaluate a classifier, and you should always compute it. However, sometimes it doesn’t fully describe the model's performance. Let’s begin by looking at a numeric example.
Suppose that you’re building a fraud detector for card transactions. Out of 1,000 transactions, 10 are fraudulent, and the remaining 990 are legitimate. The label of each transaction is “fraud” or “legitimate”, and the goal of the model is to guess the label from the features of each transaction: the amount, the merchant, the time of day, and so on.
Now, can you think of a completely useless model that is correct 99% of the time on this dataset? It could be a model like this: simply categorize every transaction as legitimate. It’s a trivial model, but it’s still a model even if it predicts everything as one class. What is the accuracy of this model? Out of 1,000 transactions, it’s wrong 10 times and right 990 times. This gives an accuracy of 99%. However, the model will never catch a fraud, which is terrible.
So what's the problem with our model? The problem is that errors are not created equal. Letting a fraud through costs real money, while asking a legitimate customer to confirm a purchase costs a few seconds of annoyance. Accuracy puts the two mistakes in the same bucket and counts them the same. To distinguish a good classifier from a useless one, we need to consider which mistakes it makes, not just how many.
Four kinds of outcomes and the confusion matrix
In many cases, the total number of errors doesn’t tell us everything about the performance of a model, and we need to dig deeper and distinguish between different types of errors. So what are the two types of errors that the fraud detector can make? It can flag a legitimate transaction as fraud, or let a fraudulent transaction through as legitimate. By convention, we label the fraudulent transactions we are trying to catch as the positive class. The two types of errors have the following names:
False positive: a legitimate transaction that is incorrectly flagged as fraud.
False negative: a fraud that is incorrectly classified as legitimate.
In general, a false positive is a data point with a negative label that the model wrongly classifies as positive. A false negative is a data point with a positive label that the model wrongly classifies as negative. Clearly, the correct predictions also have names:
True positive: a fraud that is correctly flagged as fraud.
True negative: a legitimate transaction that is correctly classified as legitimate.
Let’s stop and think. Which one sounds like a worse mistake for the fraud detector: a false positive or a false negative? When the model flags a transaction, the customer gets a message asking to confirm the purchase, and when the model lets a transaction through, the money moves. A false positive is a small nuisance because it means a legitimate customer will have to confirm a purchase they really made. A false negative means the fraud goes through and somebody loses money. So in the fraud detector, a false negative is much worse than a false positive.
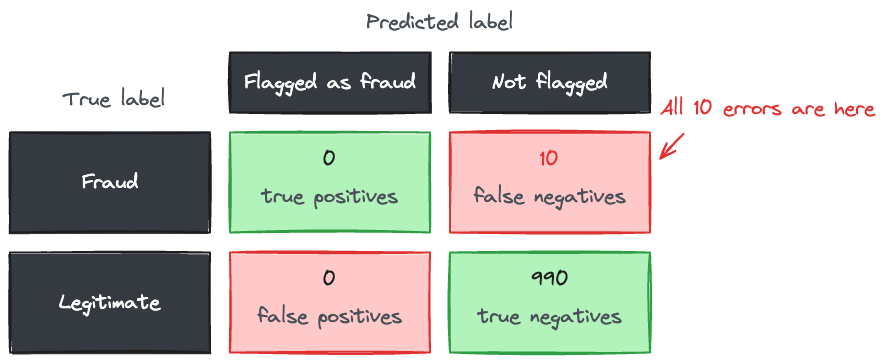
Let’s go back to the model that marks every transaction as legitimate. It made only 10 errors out of 1,000 transactions. However, all of them were false negatives, which is the worst kind of error. If those 10 errors were false positives instead, the model would be much better. The problem with measuring accuracy is that it treats both types of errors as equally serious and doesn’t tell them apart.
To keep track of the four quantities, we put them together in a table named the confusion matrix. For a binary classifier, the confusion matrix has two rows and two columns. In the rows, we write the true labels (fraud or legitimate), and in the columns, we write the predicted labels (flagged or not flagged). The elements on the diagonal are classified correctly, and the elements off the diagonal are not. The name comes from the fact that the matrix makes it easy to see whether the model is confusing the two classes. This is the confusion matrix of our do-nothing model: