


Hi Friends,
Welcome to the 187th issue of the Polymathic Engineer newsletter.
This week, we continue our series of articles on machine learning. In a recent article, we addressed the perceptron, the oldest and simplest classification model. We saw how it can count the words in a review, compute a score, and determine whether the review is “happy” or “angry” based on the sign of the score.
At the end of that article, we observed that the perceptron has one limitation: it can only answer a hard yes/no. A review with a score of 0.1 and a review with a score of 100 are both labeled as happy. But the two cases are distinct. The first review is right on the happy/angry edge, and the model is just guessing. The second one is deep in the happy zone, and there is no doubt about it.
We usually want a model that can tell us how confident it is. A spam filter that informs us an email is spam with 99% probability is far more valuable than one that simply tells us it is spam. We gain enough confidence to do the right thing: delete the email immediately or move it to a folder to look at it again later.
This is exactly what logistic regression does. Instead of predicting a specific label, it gives a number between 0 and 1 that we can interpret as a probability. The nice thing is that very little changes with respect to the perceptron: weights, bias, and score all stay the same. All we do is swap one function at the end.
Logistic regression is worth knowing well for two reasons. It is one of the most widely used classification models in practice, and its underlying function is present in every neural network. Understanding it makes deep learning much easier to grasp.
The outline is as follows:
From the Step Function to the Sigmoid
Scoring Reviews with Probabilities
The Log Loss
Comparing two classifiers
The Logistic Trick
The Logistic Regression Algorithm
More Than Two Classes: The Softmax
Putting Everything Into Practice
To learn technical skills, you must work on real projects. CodeCrafters is a great platform for that. You can build your own Redis, Kafka, DNS server, SQLite, HTTP server, or Git from scratch using your chosen programming language.
From the Step Function to the Sigmoid
The perceptron makes its prediction using a two-step process. First, it computes a review’s score as the weighted sum of the counts of words plus the bias. Then it applies the step function, which returns 1 if the value is 0 or higher, and 0 otherwise.
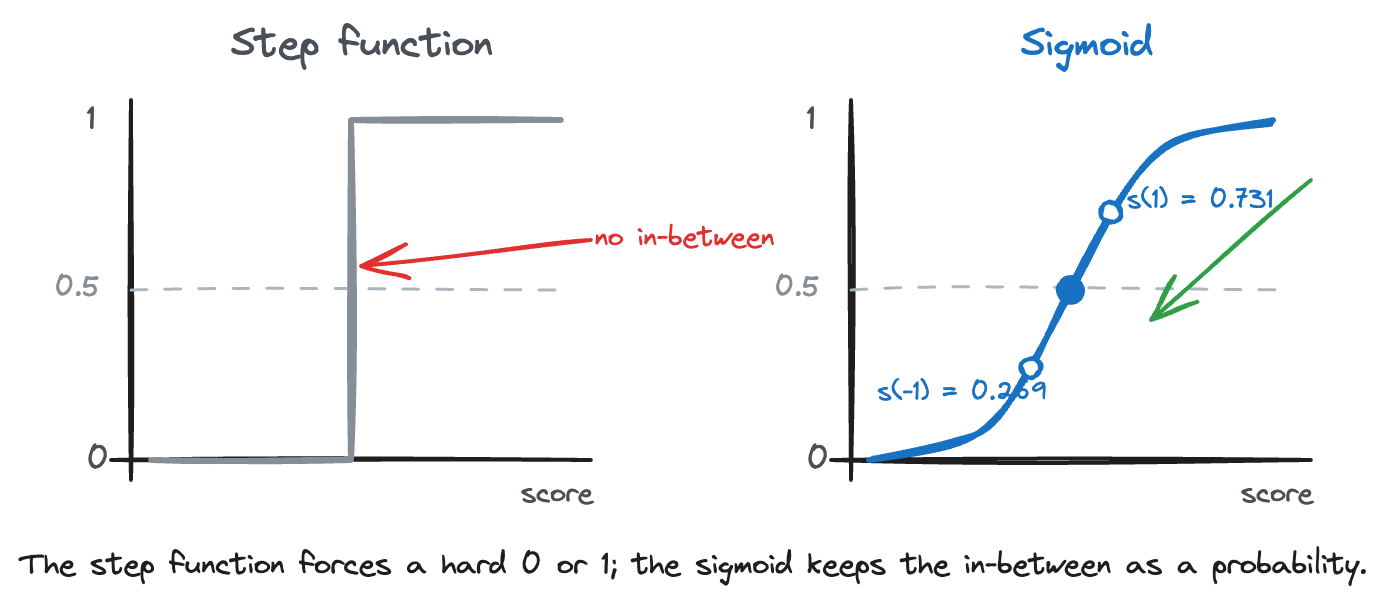
The score already contains the confidence information we want, but this information is lost in the step function, which maps every positive score to the same value of 1. So the aim is to keep the score and replace the step function with a function that preserves the information. This is how such a function should work:
If the score is a large positive number, the output is close to 1.
If the score is a large negative number, the output is close to 0.
If the score is zero, the output is 0.5, meaning the model can’t decide.
Many functions behave this way, but the standard choice is the sigmoid function:
sigmoid(x) = 1 / (1 + e^(-x))The formula matters less than what the function does: it takes the whole number line and squashes it into the interval between 0 and 1. A few values are enough to see the pattern:
sigmoid(-5) = 0.007
sigmoid(-1) = 0.269
sigmoid(0) = 0.5
sigmoid(1) = 0.731
sigmoid(5) = 0.993
The prediction of a logistic regression model is the sigmoid applied to the score:
prediction = sigmoid(w1 × x1 + w2 × x2 + bias)From a geometrical point of view, the boundary line is still there. Reviews on the line score 0, so they get a prediction of 0.5: the model can’t tell if they are happy or angry. The deeper a review goes into the happy zone, the closer its prediction gets to 1; the deeper it goes into the angry zone, the closer it gets to 0. No review ever gets exactly 1 or 0, so the model is never 100% certain about anything.
In the perceptron article, we said that the step function is an activation function. The sigmoid is the second activation function we meet, and by far the most important one historically: it powered neural networks for decades.
The sigmoid has one additional advantage over the step function, which is clear when we train the model. The step function is flat everywhere except at zero, so the error changes in large steps and provides no indication of which direction is better. The sigmoid is instead smooth and curved, so a minor change in weights always produces a small change in predictions. This is what makes gradient descent work.
A quick note about the name, since it is a bit peculiar. You might wonder why the model is called logistic regression even if it solves classification problems. There are two reasons for that. First, the sigmoid is also known as the logistic function. Second, the model technically gives a number, the probability, rather than a category.
If we want a category, and not a probability, the rule is simple: happy if the prediction is 0.5 or more, angry otherwise. This rule always agrees with the perceptron because scores of 0 or more lead to predictions of 0.5 or more. The line of the boundary doesn’t move; what changes is the confidence on either side.
Scoring Reviews with Probabilities
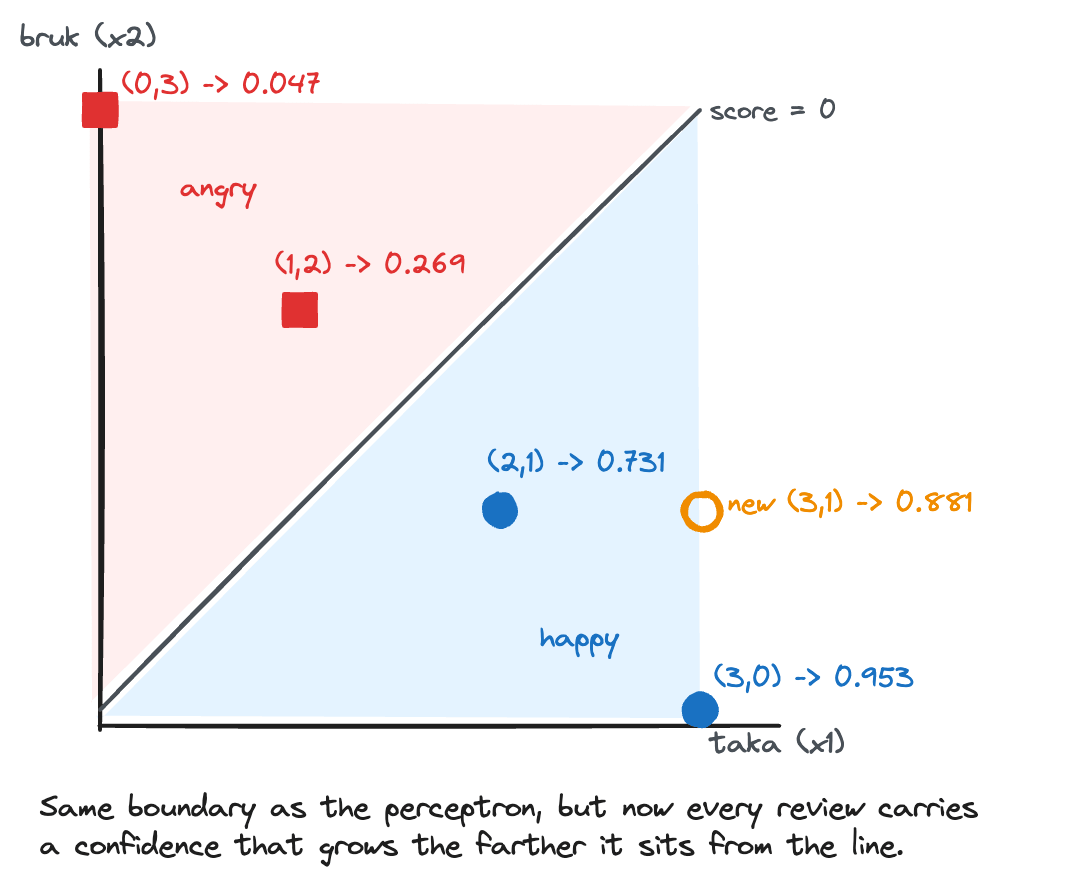
Let’s see the sigmoid in action on the 4 reviews from the first country. As a classifier, we use the one we built by hand in the perceptron article: a weight of +1 for taka and -1 for bruk, with a bias of 0. A review’s score is the number of takas minus the number of bruks, and the prediction is the sigmoid of that score:
“Taka taka taka!” at (3, 0): score 3, prediction sigmoid(3) = 0.953
“Bruk bruk bruk!” at (0, 3): score -3, prediction sigmoid(-3) = 0.047
“Taka taka bruk!” at (2, 1): score 1, prediction sigmoid(1) = 0.731
“Bruk taka bruk!” at (1, 2): score -1, prediction sigmoid(-1) = 0.269
The two happy reviews have predictions above 0.5, and the two angry reviews have predictions below 0.5. All 4 reviews end up in the correct class, exactly like with the perceptron. However, the numbers now tell us more. The model is more confident about "Taka taka taka!" than about "Taka taka bruk!", which is consistent with the intuition: three takas and not a single bruk make a stronger case than a mixed review.
There is another way of thinking about these numbers, which will be important in a moment. The 0.731 output suggests that the model believes the review is happy with 73% probability and angry with 27% probability. Every prediction has both pieces of information. The prediction is the probability of a happy review, while the probability of an angry review is 1 minus the prediction.
Last, the new review. "Taka bruk taka taka!" lands at (3, 1), with a score of 3 - 1 = 2 and a prediction of sigmoid(2) = 0.881. The model in the perceptron article simply returned “happy”. The model now answers that it’s happy with 88% probability. Same guess, but this time we know how much to trust it.
The Log Loss
We now have a model that provides probabilities, but we still need a way to assess its performance. In the perceptron article, we built an error function that was large for a bad classifier and small for a good one, then let the machine minimize it. We need the same thing here, and it takes a couple of tries to get right.