


Hi Friends,
Welcome to the 182nd issue of the Polymathic Engineer newsletter.
In a recent article, we covered linear regression: how a machine learns to draw a line through your data and guess a number, like the salary of an engineer. But many of the questions we worry about in practice don’t have a number as an answer. Is this email spam or not? Is this patient sick or healthy? Will this user click or not?
Guessing a category rather than a number is known as classification, and it is one of the most important areas of machine learning. In this issue, we look at the oldest and simplest classification model: the perceptron. Invented in 1957, the perceptron is the building block of every neural network in use today. Once you grasp how a perceptron works, you have done a good part of the work needed to understand deep learning.
The outline is as follows:
Building an Intuition: Opinion Mining
Why We Need a Bias
Weights, the Score, and the Step Function
More Than Two Words: Hyperplanes
How Good Is a Classifier? The Perceptron Error
The Perceptron Trick and the Perceptron Algorithm
A Bit of History: Where Perceptrons Fall Short
Putting Everything Into Practice
How Is AI Changing Software Architecture?
AI is introducing new architectural questions. Other than models and frameworks, architects are now considering governance, reliability, agentic systems, inference at scale, and how AI fits within existing software ecosystems.
ARC 2026: Software Architecture in the Age of AI is an event that brings together software architects and engineering leaders from Google, AWS, Salesforce, Netflix, and other leading technology organizations to share how they’re tackling these challenges.
If these are conversations you are having within your team, the agenda is worth exploring.
25-26 July (Virtual)
Register here: ARC 2026
Use the code POLYMATHIC50 to get 50% off (Valid for the first 10 users)
Building an Intuition: Opinion Mining
Let’s suppose that your company launches an app in a foreign market, and the reviews start coming in. Each review has a star rating, so you know which ones are happy and which ones are angry. However, the reviews are written in a language you don’t speak, and you would love to know what makes a review positive or negative.
You notice that two words keep showing up, taka and bruk, so you pick 4 reviews and count how many times each word appears:
“Taka taka taka!” (5 stars): taka 3 times, bruk 0 times
“Bruk bruk bruk!” (1 star): taka 0 times, bruk 3 times
“Taka taka bruk!” (5 stars): taka 2 times, bruk 1 time
“Bruk taka bruk!” (1 star): taka 1 time, bruk 2 times
Then a new review arrives: “Taka bruk taka taka!”. There is no star rating yet, so what do you think it says? Likely, something good. Although you don’t speak the language, you can observe that taka appears more in the positive reviews and bruk more in the angry reviews.
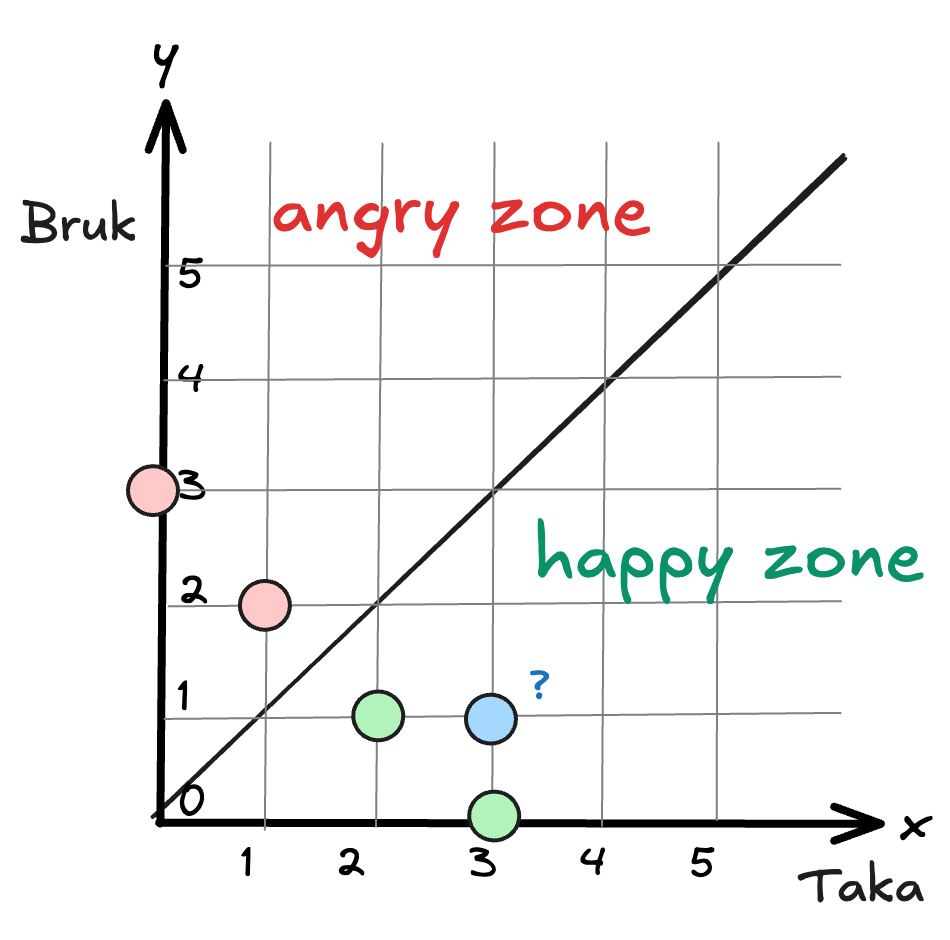
We can turn this intuition into a rule. Give each word a score: taka gets +1 point, and bruk gets -1 point. To classify a review, add up the scores of all its words. If the total is zero or more, predict the review is happy. If it is negative, predict it is angry. The new review scores 3 - 1 = 2, so we predict it is happy.
The rule we just made is a perceptron. There is also a nice way to see it geometrically. If we plot each review on a 2D graph, with the number of times taka appears on the horizontal axis and bruk on the vertical axis, the happy reviews end up on the bottom right and the angry ones on the top left. The two groups are divided by the line where both words appear the same number of times. Everything below the line means happy, and everything above means angry.
That is what a perceptron does: it draws a line that separates the two classes of points.
Why We Need a Bias
A few months later, your app takes off in another country. Again, the reviews arrive in a language you don’t speak, and two words keep popping up: miko and zumi. You pick 6 reviews and count how many times each word appears:
“Miko!” (1 star): miko 1 time, zumi 0 times
“Zumi zumi!” (1 star): miko 0 times, zumi 2 times
“Miko zumi miko!” (1 star): miko 2 times, zumi 1 time
“Zumi miko zumi zumi!” (5 stars): miko 1 time, zumi 3 times
“Miko zumi miko zumi!” (5 stars): miko 2 times, zumi 2 times
“Miko miko zumi zumi miko!” (5 stars): miko 3 times, zumi 2 times
Let’s try the same approach and give each word a score. However, this time something doesn’t add up. Both words appear in happy and angry reviews, so neither one seems positive or negative on its own. But if you look closer, you can see a different pattern: all the angry reviews are short, while all the happy reviews are long. When people are sad in this country, they drop a few words and move on. When people are happy, they write more. What decides the mood is not which words appear, but how many.
We can turn this into a rule, too. Give both words a score of +1, then add them up and guess “happy” if the sum is 4 or more. To make the math easier later, we use a cutoff of 3.5 instead: happy if the score is above 3.5, angry if it is below.
However, most of the time, perceptrons are not written by comparing the score to a cutoff. The standard way is to move the cutoff into the score itself. Instead of asking “is the score at least 3.5?”, we add -3.5 to the score and ask “is the result at least 0?”. The first question is the same as the second, but the second always compares to zero, regardless of the dataset. This extra number is known as the bias, and it’s the negative of the cutoff.
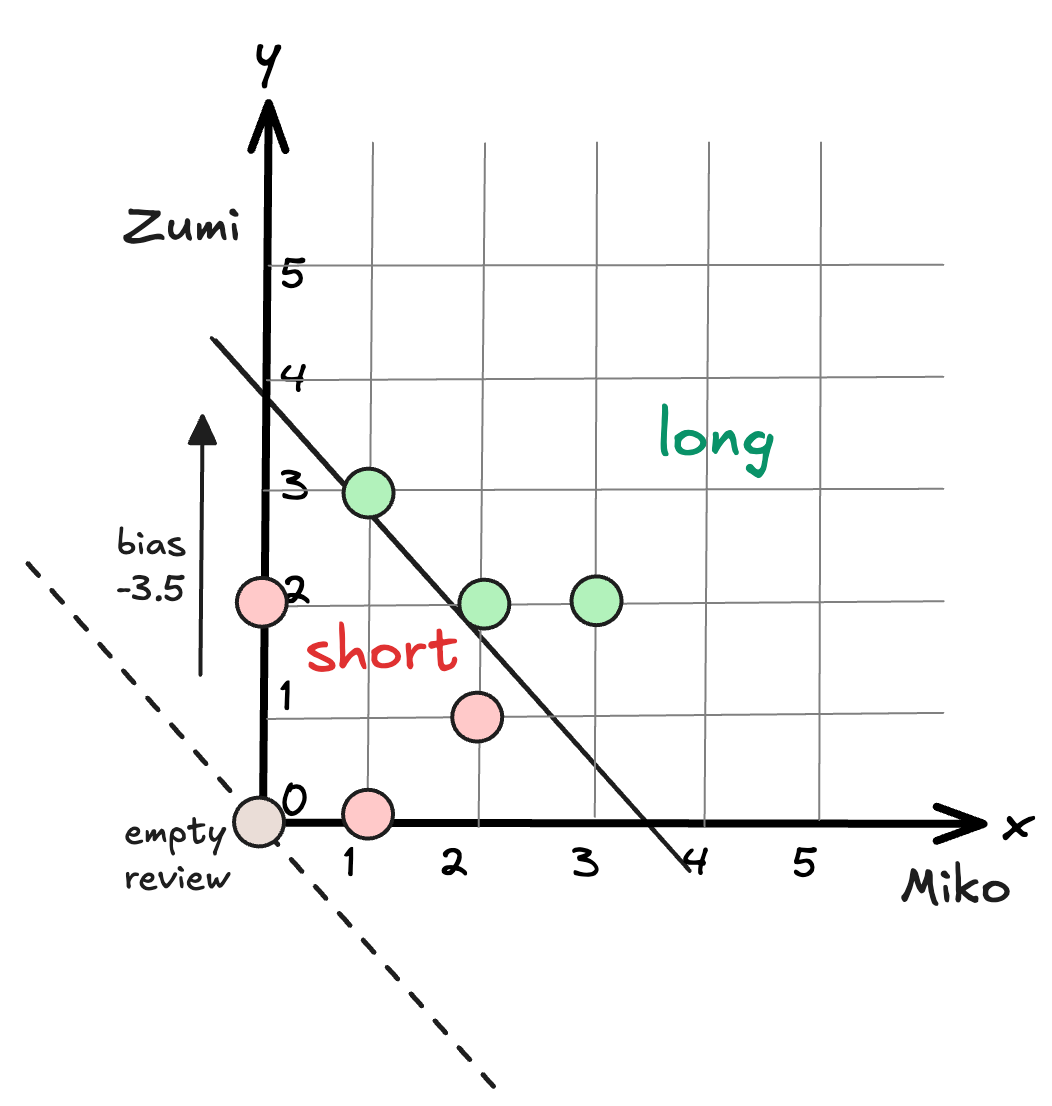
The bias has a nice interpretation: it is the score of an empty review. A review with no words is marked as “happy” if the bias is positive and “angry” if it is negative. In our case, the bias is -3.5, and that matches the data: users in this country who say nothing extra are likely upset. You can find both situations in the real world. In app stores, an empty review usually comes with 5 stars, since happy users just tap a rating and leave (positive bias). On the other hand, no one opens a support ticket to say that everything works fine (negative bias).
In terms of geometry, the bias moves the line away from the origin. The first dataset’s line went through the point (0, 0); this one crosses the axes at 3.5. The weights decide the direction of the line, and the bias decides where it sits.
Weights, the Score, and the Step Function
Now that we have built two classifiers by hand, it is a good moment to give the pieces their official names. The counts of each word are the features, which are what we use to guess. The scores we assigned to the words are known as the weights, and are what the model learns from the data together with the bias. If this sounds like something you have seen before, it’s because you have seen it in the linear regression article. The score of a review is calculated with the same formula we used to guess a salary:
score = w1 × x1 + w2 × x2 + biaswhere x1 and x2 are the number of times each word appears, and w1 and w2 are their weights.
One more thing is needed: turning the labels into numbers. Machine learning models work with numbers, not with moods, so from now on “happy” becomes 1 and “angry” becomes 0. To make the prediction match, we use a function called the step function. The step function returns 1 if its input is 0 or more, and 0 if its input is negative:
prediction = step(w1 × x1 + w2 × x2 + bias)That is the whole perceptron: weights, a bias, and a step function. The only difference from linear regression is in that last step. Linear regression returns the score directly since that is what we want, a number. The perceptron squashes the score into a 1 or a 0, since we want a category.
The step function is also what is called an activation function, a concept that plays a huge role in neural networks. For now, you can think of it as the function that turns a score into a “yes” or a “no”.
More Than Two Words: Hyperplanes
Our two examples used languages with only two words each, which is helpful because we can draw every review as a point on a 2D graph. However, real languages have a lot of words. What happens to the perceptron then?
In terms of the formula, there are no changes. Each word has a value assigned, and the score stays the same even if it has more terms:
score = w1 × x1 + w2 × x2 + ... + wn × xn + biasIn terms of geometry, the picture grows by one dimension for every word. With three words, the reviews turn into points in 3D space, and the perceptron splits them with a plane instead of a line. With n words, the points live in n-dimensional space, and the line between them is called a hyperplane. We can’t picture it anymore, but the idea is the same: there is a flat surface dividing the space into a happy and an angry side.
If the idea of hyperplanes seems too abstract, here is a mental picture that helps. Let’s imagine building the classifier for English. You have to go over the whole dictionary and assign a score to every single word: “amazing” gets +9, “refund” gets -6, “the” gets 0.1, and so on. When you want to classify a review, you add up the scores of its words and the bias, then check the sign. Words that carry strong opinions end up with large weights, and neutral words end up with weights close to zero.
One last thing to keep in mind is that this setup isn’t just for reviews. The features can be anything you can count or measure, like the symptoms of a patient or an email’s properties. As long as each feature has a weight, the perceptron works the same way.
How Good Is a Classifier? The Perceptron Error
So far we have figured out the weights and the bias by looking at the data. That works for 4 reviews and 2 words, but not for millions of reviews and an entire dictionary. We want the machine to find them, so we need to teach the machine how to distinguish a good classifier from a bad one. In the linear regression article, we did this with an error function: a value that is large when the model performs badly and small when it performs well. We need the same thing here, and it turns out that building it takes three attempts.