
Linear Regression
How machines learn to draw a line through your data and make predictions.

Hi Friends,
Welcome to the 170th issue of the Polymathic Engineer newsletter.
Linear regression is a fundamental algorithm in machine learning. Even though it is simple and intuitive, many engineer treat it as a black box. They call a function from scikit-learn, get a result, and move on.
But understanding what happens under the hood is critical because linear regression is the basis for more complicated models like neural networks. In this issue, we break down linear regression from the ground up.
We start with a simple example, build an intuition for how it works, and then explore the math and algorithms that make it all possible. The outline is as follows:
What is Linear Regression?
Building an Intuition: Predicting Salaries
Features, Weights, and Bias
How to Find the Best Line?
Measuring How Good a Model Is: Error Functions
From One Feature to Many: Multivariate Linear Regression
Polynomial Regression
Parameters vs Hyperparameters
Real-World Applications
Putting Everything Into Practice
Regardless of whether you are an experienced engineer who wants to brush up on the basics or a younger engineer exploring machine learning for the first time, this article will give you a solid understanding of how linear regression works and why it matters.
Project-based learning is the best way to develop technical skills. CodeCrafters is an excellent platform for tackling exciting projects, such as building your own Redis, Kafka, a DNS server, SQLite, HTTP server or Git from scratch using your favourite programming language. Noe you can also try to build your own Claude Code (for free, still in beta).
Sign up, and become a better software engineer.
What is Linear Regression?
Let’s start with the basics. Say you have a set of data points that roughly look like they are forming a line. The goal of linear regression is to draw the line that passes as close as possible to all of them.
Think of the data points as houses in a town, and your goal is to build a road that goes through the town. Everyone wants to live near the road, and your job is to make them as happy as possible. The road should go as close as possible to all the homes.
Of course, this leads to some questions like
What do we mean by “points that roughly form a line”?
What do we mean by “a line that passes really close to the points”?
How do we find such a line?
Why is this useful in the real world?
We answer all these questions in the following sections.
Building an Intuition: Predicting Salaries
Let’s suppose that you want to guess a software engineer’s salary based on their years of experience. You get some information from a few engineers and get something like this:
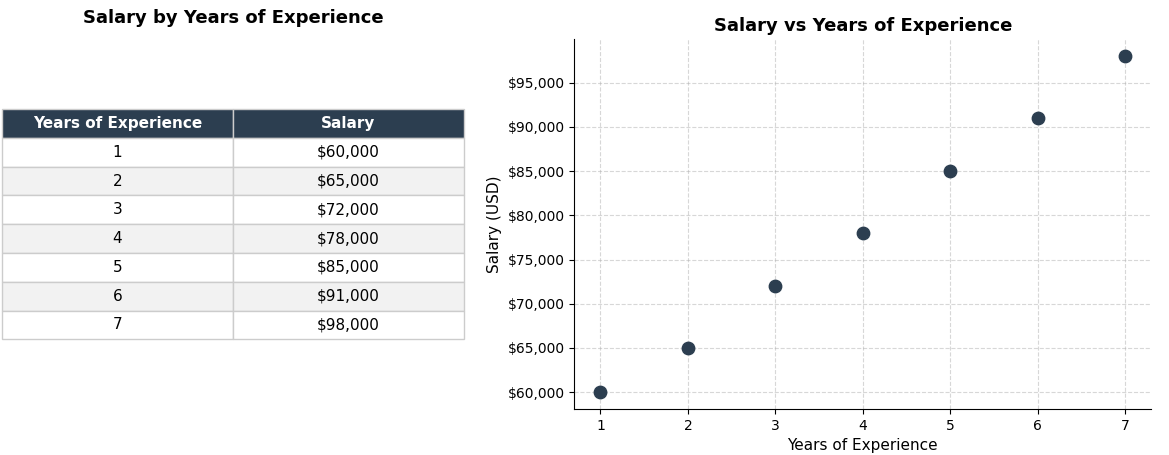
If you plot the data on a coordinate system, with years of experience on the x-axis and salary on the y-axis, you see that the dots make a line that goes up. The more you are experienced, the more money you make (we all know it doesn’t work exactly like that, but let’s pretend for the sake of this example).
Now, let’s say that a new engineer starts working for your company. She has 4.5 years of experience and you need to make her an offer. There isn’t a data point for 4.5 years, but you can do it another way: you can find out where 4.5 falls on the line and read the salary. That is linear regression in a nutshell.
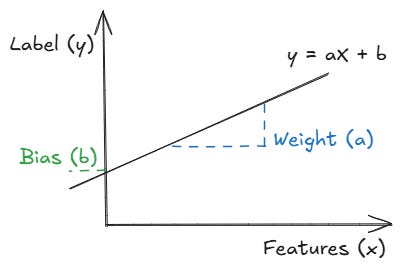
What the model actually learns is a simple equation:
Salary = weight × (years of experience) + bias
The weight shows you how much the salary goes up for each year of experience. The bias is the starting point: starting salary with zero experience. We will get into what these two terms mean in detail in the next section.
Features, Weights, and Bias
Let’s have a look at the building blocks of linear regression. There are four things you need to know:
Features: they are the inputs we use to make a prediction. In our example, years of experience are the feature. But in a more complex model, we could have many features: programming languages known, location, company size, and so on.
Label: they are what we are trying to guess. In our case, the label is the salary.
Weights: they tell the model how much each feature matters. Going back to our equation, the weight might be something like 6,500, since for every extra year of experience, the salary increases by that amount. If the weight was negative, it would mean that more experience is associated with a lower salary, which would be strange. A weight close to zero means the feature barely matters. If you added a feature like the number of monitors on the desk and its weight turned out to be near zero, the model is telling you it doesn’t help guess the salary.
Bias: it is the starting point. It is the salary the model would guess if the engineer had zero years of experience. In practice, the bias is just there to give the line the flexibility to sit at the right height on the graph.
In other words, the model finds the best weights and bias values that make the line fit the data. That’s the whole process of learning. We’ll talk about how it does that in the next part.
How To Find the Best Line?
You could draw an endless number of lines through a set of data points. The question is: which one is the best? The answer is the line that is as close as possible to all data points. But we need to be more precise. Here, “Close to all the points” means the total distance between the line and the data points is as small as possible.
In this context, the distance between what the model predicts and what the data point says is called an error or residual. There are two main ways to find this line.