Statistics
Why knowledge of statistics is essential also as a software engineer.


Hi Friends,
Welcome to the 33rd issue of the Polymathic Engineer newsletter.
While not every software engineer will need to use statistics in their day-to-day work, grounding in statistics can open up more opportunities and allow for handling a more comprehensive range of tasks effectively.
On this issue, I want to elaborate on how knowing the fundamentals of statistics is essential and which concepts to focus on.
Statistics fundamentals
There are countless reasons to learn statistics also as a software engineer:
software is about crunching data, and statistics is what you need to analyze data
statistics is required to design algorithms dealing with randomness or probability
if a software engineer works with machine learning algorithms, statistics is essential. Most machine learning techniques, like regression, classification, or clustering, are based on statistical principles.
statistics is crucial to interpret test results, analyzing performance data, and then optimizing software
tasks like predicting system load or handling sensor data involve statistics
A/B testing is a common practice in software development to compare different product versions. Knowledge of statistics helps design these tests, analyze results, and make data-driven decisions.
The problem is that statistics is a large field, so the question is on which concepts a beginner should focus on. There are 5 core concepts that everyone should get familiar with and that I use all the time.
Mean and Median
Mean and median measure the center of a data set in different ways and are known as measures of central tendency.

The mean divides the sum of the values by the number of items in the set. The median is the middle value in the set when it is sorted.
The main difference is that the mean is pulled toward the extreme values, while the median is not.
Mode
The mode measures the value in a data set that occurs most frequently. So, any time someone speaks of the most popular or common item in a set, that person is likely referring to the mode of the set.

Note that mode can be more than one value. For example, in the set {2,2,3,5,5}, there are two modes: 2 and 7.
That is useful in many scenarios:
- find the most common item in non numeric data sets
- find the “typical” value of a dataset
- identifying multiple peaks of values (multi-modal distributions)
Also the mode is a measure of central tendency and in a normal distribution, we would expect the median, mean, and mode to all be close to the same value.
Percentile
In many real-world scenarios, knowing the center of a data set is not enough. The x-percentile gives a value so that x% of the data in the set are below that value.

According to this definition, the median is nothing more than the 50-percentile of a dataset. This observation comes especially handy to calculate also the 25-percentile and the 75-percentile.
The 25-percentile is the median of the lower half of the data, while the 75-percentile is the median of the upper half of the data.
Mean absolute difference
The measures of central tendency find the center of the distribution, but we are often interested to know how much the data are dispersed.

Suppose we want to describe how data varies from this center. One way is to use the range, which describes the distance between the smallest and largest value in a set. The problem is that the range ignores all the values in a set except for the largest and smallest, and therefore tells us nothing about the distribution of the values within the data set.
A better way to check how data varies from this center is the mean absolute difference.
This measure provides information about the total spread of values in a data set, summarizing in a single number how much the data varies from this center. It corresponds to the average distance between each value and the mean.
The median absolute deviation is a similar kind of statistic, that calculates the median value of the absolute difference from the median.
Variance and Standard Deviation
Variance and Standard Deviation are the two most commonly used ways to measure the spread of the data.
The variance is the average squared distance between each value and the mean. The standard deviation is the squared root of the variance.
The lower they are the more the data set is distributed around a central value.
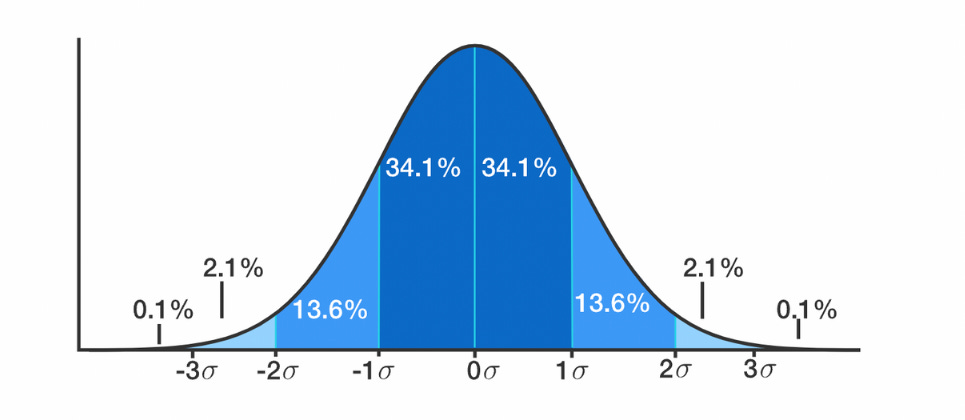
When data is distributed around a central value with no bias, it get close to a normal distribution. For data following a normal distribution:
68% of the data lies within one standard deviation of the mean
95% of the data lies within two standard deviations of the mean
99.7% of the data lies within three standard deviations of the mean
Additional resources
A couple of useful books to study statistics:
An Introduction to Statistical Learning: with Applications in R by Gareth James
Head First Statistics: A Brain-Friendly Guide by Dawn Griffiths
Interesting Tweets
Especially at the beginning, reinventing the wheel has high value. One reason I'm glad that I start programming in C is that only few libraries and data structures were available. All the others I had to implement myself and I learned lot. Link

What's really important is to learn the principles of how Git works, not knowing the commands by heart. That knowledge will last forever, command you can always look up. Link

Many "tech influencers" try to convince other developers that knowledge of algorithms and data structures is not relevant. But that’s completely false. Sure, probably you won't apply everything during your career but such knowledge influence your way to tackle and solve problems. Link