Back of the envelope
How to measure a system capacity or performance requirements and choose the best design.
Hi Friends,
Welcome to the 115th issue of the Polymathic Engineer newsletter.
This week, we talk about a skill that has to do with math and it’s extremely valuable for every software engineer: back of the envelope calculation. The outline will be as follows:
What is a back of the envelope calculation?
Back-of-the-envelope fundamentals
Common Types of Estimations
Tips and key principles
A practical example
Project-based learning is the best way to develop technical skills. CodeCrafters is an excellent platform for practicing exciting projects, such as building your version of Redis, Kafka, DNS server, SQLLite, or Git from scratch.
Sign up, and become a better software engineer.
What is a back of the envelope calculation?
Back-of-the-envelope calculation is a quick way to make guesses using simple math and assumptions. While being able to do such rough estimates is a valuable skill for any software engineer, it comes especially handy during system design interviews.
There, the ability to do quick calculations is helpful for several reasons:
It helps figure out if your architecture meets the needs and can handle the load that is expected.
It lets you find possible performance problems and make the design changes that are needed.
It shows you can make decisions and trade-offs based on a set of assumptions and constraints
It gives you more confidence when you talk to the interviewer about your design choices and what they mean.
The term "back of the envelope" comes from the idea that these calculations are easy enough to be done on the back of an envelope or a piece of paper. They don't have to be exact, but they should be close enough to trust.
Their goal is to help people talk about scalability and explain why certain parts of the system are made the way they are without having to create prototypes or do in-depth studies, which would take a lot of time.
Back-of-the-envelope fundamentals
To perform practical back-of-the-envelope calculations, it's important to understand and apply some fundamental concepts.
First of all, computers deal with binary data all the time, so it's critical to know how to work with powers of two. Knowing the following numbers will help you quickly guess the amount of a data set:
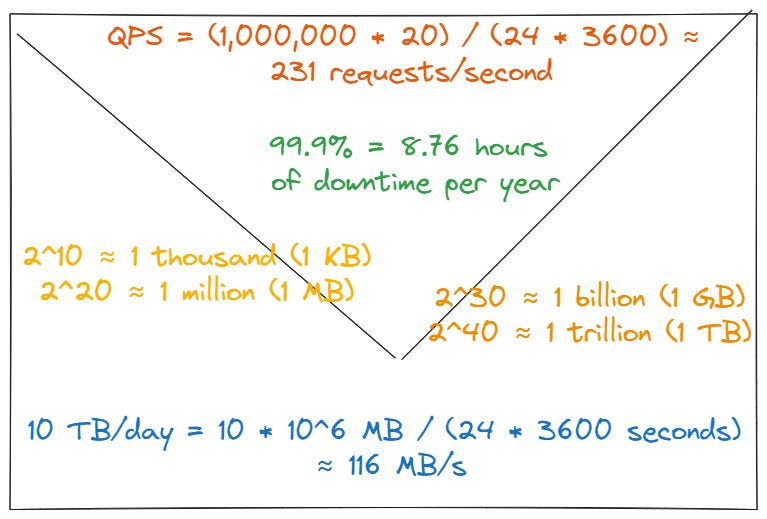
2^10 ≈ 1 thousand (1 KB)
2^20 ≈ 1 million (1 MB)
2^30 ≈ 1 billion (1 GB)
2^40 ≈ 1 trillion (1 TB)
Knowing the most common data sizes is also important to figuring out how much space and bandwidth you need. Here are some examples:
1 byte = 8 bits
ASCII character = 1 byte
Integer = 4 bytes
Timestamp = 4 bytes (second precision) or 8 bytes (millisecond precision)
IPv4 address = 4 bytes
To evaluate design alternatives, you also need to get a general idea of how long typical operations take. In a famous talk at Stanford in 2010, Google’s Senior Fellow Jeff Dean introduced a list of latency numbers that every developer should know:
L1 cache reference: 0.5 ns
L2 cache reference 7 ns
Mutex lock/unlock25 ns
Compress 1K bytes with Zippy 10 us
Send 1 KB bytes over 1 Gbps network 10 us
Read 4 KB randomly from SSD 150 us
Read 1 MB sequentially from memory 250 us
Round trip within same datacenter 500 us
Read 1 MB sequentially from SSD 1 ms
HDD seek 10 ms
Read 1 MB sequentially from 1 Gbps 10 ms
Read 1 MB sequentially from HDD 30 ms
Send packet CA->Netherlands->CA150 ms
Even if technology evolved, and such numbers have changed over the last 10+ years, they give an solid grasp of the order of magnitude of the different operations. For the interested people, here is a tool that visualizes how the latency numbers have changed over the last 20 years.
In any case, there are some important points you can learn. For example, reading and writing from/to the disk takes much longer than from/to the memory. Or it's quick to use simple compression methods, and compressing data before sending it over the internet is a must whenever possible.
The last category of numbers that is important to know is availability numbers. High availability means that even if something goes wrong, you can still reach a service and not lose any data.
Usually, a percentage of uptime over a certain amount of time is used to measure high availability. When a product or service is up, it means that it is available and working.
Real systems need to guarantee a high level of availability with all nines in percentage:
99% = 3.65 days of downtime per year
99.9% = 8.76 hours of downtime per year
99.99% = 52.56 minutes of downtime per year
99.999% = 6 minutes of downtime per year
As an alternative, availability can also be measured by time between failures (MTBF) that shows how long it usually takes for a system to work again after a failure, and mean time to repair (MTTR) that shows how long it usually takes to fix a system after it has failed. If you’re interested in more details about availability, and related metrics, you can check this previous article.
Common Types of Estimations
In system design interviews or real-world situations, you are more likely to come across the following types of estimates:
Traffic Estimation: this is the process of figuring out how many calls a system needs to handle. Monthly Active Users (MAU) and Daily Active Users (DAU) are the most important things to think about. Other important things are Queries per second (QPS), the read-to-write ratio of queries, and peak vs. normal traffic. As an example, if a service has 1 million DAU and each user makes 20 requests per day:
QPS = (1,000,000 * 20) / (24 * 3600) ≈ 231 requests/second


